Hello,
This email message is a notification to let you know that
a file has been uploaded to the Files area of the geology2
group.
File : /The Volcano That Gave Birth to a Monster.pdf
Uploaded by : lin.kerns <linkerns@gmail.com>
Description : Excerpt from Tambora by Gillen D'Arcy Wood
You can access this file at the URL:
https://groups.yahoo.com/neo/groups/geology2/files/The%20Volcano%20That%20Gave%20Birth%20to%20a%20Monster.pdf
To learn more about file sharing for your group, please visit:
https://help.yahoo.com/kb/index?page=content&y=PROD_GRPS&locale=en_US&id=SLN15398
Regards,
lin.kerns <linkerns@gmail.com>
------------------------------------
------------------------------------
------------------------------------
Yahoo Groups Links
<*> To visit your group on the web, go to:
http://groups.yahoo.com/group/geology2/
<*> Your email settings:
Individual Email | Traditional
<*> To change settings online go to:
http://groups.yahoo.com/group/geology2/join
(Yahoo! ID required)
<*> To change settings via email:
geology2-digest@yahoogroups.com
geology2-fullfeatured@yahoogroups.com
<*> To unsubscribe from this group, send an email to:
geology2-unsubscribe@yahoogroups.com
<*> Your use of Yahoo Groups is subject to:
https://info.yahoo.com/legal/us/yahoo/utos/terms/
Thursday, December 31, 2015
[Geology2] Hawaii's Swelling Lava Lake Charts a Volcano's Hidden Plumbing
Hawaii's Swelling Lava Lake Charts a Volcano's Hidden Plumbing
Geophysicists used unique seismic signatures to track the cyclic rise and fall of lava inside Hawai'i Volcanoes National Park's Overlook crater.
Source: Journal of Geophysical Research: Solid Earth
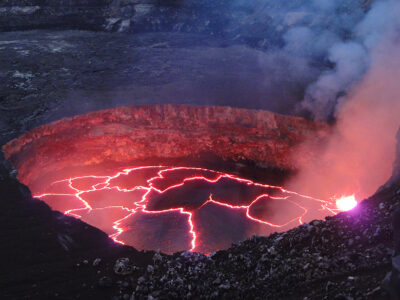 Over the past 7 years, the "Overlook crater" near the summit of Kilauea Volcano has grown from just 35 to more than 200 meters wide and now hosts one of the largest lava lakes in the world (shown here). Recent research sheds light on gas-pistoning activity that may have contributed to the dramatic rise and fall of lava columns connected to the crater. Credit: USGS
 By Eric Betz 30 December 2015
It's been 7 years since an explosive eruption left a massive hole in Halemaʻumaʻu crater, just below an overlook point at the summit of Kilauea Volcano in Hawaiʻi Volcanoes National Park. As the surrounding walls have collapsed, the "Overlook crater" has grown from just 35 to more than 200 meters wide and now hosts an impressive lava lake. Scientists suspect the lava lake's depth, estimated at around 200 meters, makes it among the largest in the world.
The action has been monitored by a network of Hawaiian Volcano Observatory seismometers, which allowed Chouet and Dawson to track tremors originating from a kilometer below the surface. Before the lake formed, the instruments caught degassing bursts from the top of the lava column. Since then, much of the seismic activity can be explained by rockfalls as the crater grows. A third type of activity is more puzzling, consisting of unusual pressure drops from somewhere within the magma system, but with no signs of disturbance on the lake's surface.
The authors focused their efforts on a fourth type of activity known as gas pistoning, in which the lava column sees a cyclic approximately 20-minute-long rise and fall of its thinly crusted surface. During one such period, recorded in high detail over 5 days in the summer of 2011, the lava column swelled by tens of meters and featured hundreds of gas piston events. Geologists say the activity is caused by the accumulation of gas in a layer of foam at the top of the column before it's released—often forcefully when the foam collapses.
The pair tracked the signature to a single point source that sits 1 kilometer below Halemaʻumaʻu crater's eastern flank. The seismic waves also map out the volcano's plumbing system, which consists of pipes, dikes, and fissures beneath the park that correspond well to previous attempts to chart the underground network.
Using numerical simulations, the researchers calculated that layers of foam—perhaps tens of meters high—grew and collapsed over the 5-day period and that the gas-pistoning activity likely happened in a 6-meter-wide pipe that connected the crater to an adjacent dike system. This study is central to determining the behavior of the magmatic system beneath Halemaʻumaʻu and volcanic systems in general, protecting communities in Hawaii and around the world. (Journal of Geophysical Research: Solid Earth, doi:10.1002/2014JB011789, 2015)
—Eric Betz, Freelance Writer
Citation: Betz, E. (2015), Hawaii's Swelling Lava Lake Charts a Volcano's Hidden Plumbing, Eos, 96, doi:10.1029/2015EO042055. Published 30 December 2015
https://eos.org/research-spotlights/hawaiis-swelling-lava-lake-charts-a-volcanos-hidden-plumbing--

__._,_.___
Posted by: Lin Kerns <linkerns@gmail.com>
__,_._,___
[Geology2] Spectacular Videos of Mexican Colima Volcano Erupting Again (videos)
__._,_.___
Posted by: Lin Kerns <linkerns@gmail.com>
__,_._,___
[Geology2] USGS Seismologist Says Edmond Earthquake Reactivated Fault
USGS Seismologist Says Edmond Earthquake Reactivated Fault
Posted: Dec 30, 2015
Dana Hertneky, News 9
Dana Hertneky, News 9
The earth continued to shake Wednesday in Edmond with another aftershock to Tuesday morning's 4.3-magnitude earthquake.
But a USGS seismologist now says more big earthquakes, magnitude 4.0 or even much larger in the same area are likely.
Dan McNamara said Tuesday's earthquake reactivated a new fault that runs from the Midwest Boulevard and Covell area toward downtown Oklahoma City.
Things started shaking at Covell Wine and Liquor around 5:40 a.m. Tuesday with that magnitude 4.3 earthquake and has been rattling nerves ever since.
"I was here all day and I felt the aftershocks," said owner Stephanie Sanders. "The whole building would shake and you could hear them rattling and it was nerve racking for sure."
But this may not be the end of it.
"When we see these magnitude 4's we get concerned that additional earthquakes could occur," McNamara said.
McNamara said in the past, once a fault is activated in Oklahoma it can produce multiple magnitude 4.0 earthquakes or larger. Larger, because of the type of fault that runs through Oklahoma, called a strike slip fault.
"They have been shown to produce up to Mag. 5.6 and in a few studies we have done at the USGS, we have shown that some of these faults could host earthquakes as big as Mag 6," said McNamara.
That's especially concerning in this case since the fault runs right though a highly populated area.
Staff at the Oklahoma Corporation Commission are working to take action on the Edmond earthquake.
In the past, the OCC had limited capacity on surrounding disposal wells.
McNamara said that seems to have worked and he believes it could in this case as well.
"I wouldn't be surprised to see another 4 but if they do limit disposal it will probably just stay at that level," he said.
That would be welcome news for the Sanders and her husband who were fortunate this time.
"I just worry that there will be a bigger one that will cause a lot of damage," she said.
There have been five aftershocks following Tuesday's earthquake including a 3.0-magnitude Wednesday afternoon.
http://m.news9.com/story.aspx?story=30856815&catId=112032
--
__._,_.___
Posted by: Lin Kerns <linkerns@gmail.com>
__,_._,___
[californiadisasters] California Disasters' ThreatCon: Watching CNN
Current Status: watching the Towering Inferno in Dubai.
--
Check out http://groups.yahoo.com/group/californiadisasters/
Read my blog at http://eclecticarcania.blogspot.com/
My Facebook: http://www.facebook.com/derkimster
Linkedin profile: http://www.linkedin.com/pub/kim-noyes/9/3a1/2b8
Follow me on Twitter @CalDisasters
Read my blog at http://eclecticarcania.blogspot.com/
My Facebook: http://www.facebook.com/derkimster
Linkedin profile: http://www.linkedin.com/pub/kim-noyes/9/3a1/2b8
Follow me on Twitter @CalDisasters
__._,_.___
Posted by: Kim Noyes <kimnoyes@gmail.com>
Be sure to check out our Links Section at http://groups.yahoo.com/group/californiadisasters/links
Please join our Discussion Group at http://groups.yahoo.com/group/californiadisasters_discussion/ for topical but extended discussions started here or for less topical but nonetheless relevant messages.
__,_._,___
[californiadisasters] On This Date In California Weather History (December 31)
2014: A very cold and potent low pressure system dropped very low-elevation snow during this night and into 12/31.
Snow levels dropped rapidly overnight down to as low as 1000 feet.
The southern Inland Empire was hardest hit. 10"-18" fell across Palomar Mountain, 6"-9" from Warner Springs to Julian, 2"-4" in Temecula, Wildomar, and Lake Elsinore, and 4"-8" across Highway 74 and Horsethief canyon in the Santa Ana Mountains.
Several road closures resulted, including Highway 74 and Highway 18, and vehicles were stranded.
2013: Fresno ended the driest calendar year on record with only 3.01" (26 percent of the normal of 11.5", or 8.49" below average).
This was the first year on record for Fresno to receive less than 1" of precipitation per month in every month.
Fresno also had the warmest year on record with an average temperature of 66.9° F.
Many other locations throughout the Hanford warning and forecast area received well below average rain and snow for calendar year precipitation.
Bakersfield tied for the 2nd driest December on record; only a trace of precipitation fell during the month.
The Decembers of 1989 and 1930 remain the driest Decembers on record for Bakersfield when no precipitation was measured.
2006: Very heavy rainfall produced extensive flooding in Reno and Sparks, NV.
2004: 29" of snow fell at Tahoe City, with 28" reported at Mammoth Lakes Ranger Station.
2002: A mountain wave generated an 84 mph wind gust at Inyokern, causing a tree to fall over and kill one person.
2001: Quick moving front deposited heavy snow in the Sierra: 19" fell at Mitchell Meadow in 9 hours and 28" fell at Wet Meadows in 11 hours.
1999: A waterspout was observed off the coast of Costa Mesa.
Funnel clouds were reported in Santa Ana and Oceanside.
1990: Low of 24° Fin Fresno.
This was the 24th time all month that the low temperature dropped to 32° F or lower, a record for the month of December.
This also tied January 1949 for the most number of freezing low temperatures in any month.
1986: High tide in San Diego was 7.8 feet.
In Eureka the tide was 9.1 feet, thought to be the highest in a century.
Luckily the weather was fine and surf was small.
Minor flooding occurred at coastal low spots on Mission Beach and Ocean Beach and water lapped at the curbs of streets in Balboa Island, Newport Beach.
1965: A warm storm of torrential rains also melted mountain snow from 12.29 to this day.
One report said more than 13" fell in 24 hours at Mt. Baldy.
Nearly 9" did fall in Lake Arrowhead, and 1.5"-3" in the coastal lowlands.
One drowned in Lytle Creek.
Disastrous flooding and debris flows occurred in the Lytle Creek and Scotland communities, Baldy Village, and in Waterman Canyon.
Two boys were rescued from the Santa Ana River in Colton.
Numerous roads were washed out in the high desert and the mountains.
1955: Mount Hamilton received 9" of snowfall.
1940: Heavy rains that fell a week previous loosened soil along a Del Mar railroad and led to a landslide.
The slide derailed a train and killed three.
1933: A major storm hit Southern California starting on 12.30 and ending on 1.1.1934.
7.36" fell in 24 hours at LA, a 24 hour record for the city.
8.26" fell as a storm total.
Storm totals in the southern slopes of mountains topped 12" (heaviest: 16.29" in Azusa).
45 died all over Southern California in floods.
Walls of water and debris up to ten feet high were noted in some canyon areas.
1931: Yosemite Valley received 2" of snow bringing the total for the month to 54", making it the snowiest December ever on record here.
1918: It was 22° in Santa Ana, the lowest temperature on record.
This also occurred the next two days on 1.1 and 1.2.1919, and on 1.6.1950.
It was 24° in Escondido, the lowest temperature on record for December, and the second lowest temperature on record (lowest was 22° on 1.22.1937).
1915: Las Vegas and Searchlight, NV, both measured 5" of snow
1913: Reno, NV, recorded 1.74" of precipitation.
1909: A terrible storm dropped 4.23" of rain in San Bernardino on this day and on 1.1.1910.
Lytle Creek and the Santa Ana River flooded at its highest stage in 20 years.
Railroads were severely damaged down to San Jacinto and Hemet area.
Colton was isolated. Damage in San Bernardino was the "worst in history" and homes in the west of the city were flooded.
Highways, water supplies and other utilities were damaged.
A train from LA plunged into the Santa Ana River in Colton.
1900: Only 27 hours of sunshine were observed in Fresno during December 1900.
This is just 9% of the total possible sunshine available for the month, making it not only the least sunniest December ever, but the least sunniest month ever here.
Source: NWS San Francisco/Monterey, Hanford, Reno, Las Vegas, & San Diego
--
1913: Reno, NV, recorded 1.74" of precipitation.
1909: A terrible storm dropped 4.23" of rain in San Bernardino on this day and on 1.1.1910.
Lytle Creek and the Santa Ana River flooded at its highest stage in 20 years.
Railroads were severely damaged down to San Jacinto and Hemet area.
Colton was isolated. Damage in San Bernardino was the "worst in history" and homes in the west of the city were flooded.
Highways, water supplies and other utilities were damaged.
A train from LA plunged into the Santa Ana River in Colton.
1900: Only 27 hours of sunshine were observed in Fresno during December 1900.
This is just 9% of the total possible sunshine available for the month, making it not only the least sunniest December ever, but the least sunniest month ever here.
Source: NWS San Francisco/Monterey, Hanford, Reno, Las Vegas, & San Diego
Check out http://groups.yahoo.com/group/californiadisasters/
Read my blog at http://eclecticarcania.blogspot.com/
My Facebook: http://www.facebook.com/derkimster
Linkedin profile: http://www.linkedin.com/pub/kim-noyes/9/3a1/2b8
Follow me on Twitter @CalDisasters
Read my blog at http://eclecticarcania.blogspot.com/
My Facebook: http://www.facebook.com/derkimster
Linkedin profile: http://www.linkedin.com/pub/kim-noyes/9/3a1/2b8
Follow me on Twitter @CalDisasters
__._,_.___
Posted by: Kim Noyes <kimnoyes@gmail.com>
Be sure to check out our Links Section at http://groups.yahoo.com/group/californiadisasters/links
Please join our Discussion Group at http://groups.yahoo.com/group/californiadisasters_discussion/ for topical but extended discussions started here or for less topical but nonetheless relevant messages.
__,_._,___
Wednesday, December 30, 2015
[californiadisasters] On This Date In California Weather History (December 30)
2014: A very cold and potent low pressure system dropped very low-elevation snow during this night and into 12/31.
Snow levels dropped rapidly overnight down to as low as 1000 feet.
The southern Inland Empire was hardest hit. 10"-18" fell across Palomar Mountain, 6"-9" from Warner Springs to Julian, 2"-4" in Temecula, Wildomar, and Lake Elsinore, and 4"-8" across Highway 74 and Horsethief canyon in the Santa Ana Mountains.
Several road closures resulted, including Highway 74 and Highway 18, and vehicles were stranded.
2012: A waterspout was reported off Oceanside.
A funnel was reported over Fallbrook.
2004: Due to heavy rain flash flooding occurred along the coast of Monterey County causing a landslide that closed a portion of Highway 1.
A funnel was reported over Fallbrook.
2004: Due to heavy rain flash flooding occurred along the coast of Monterey County causing a landslide that closed a portion of Highway 1.
2004: 16" of snow fell at Reno, NV.
1988: This day ended a week of subfreezing temperatures in Southern California that started on 12.24.
Five died as a result of the cold.
1987: Redding residents awoke to the first snow in three years.
North state drivers unaccustomed to snow driving found getting to work an adventure, but there were few problems, according to the California Highway Patrol.
1985: Dense fog observed in Fresno and Bakersfield on this date set records for the most days with dense fog ever in the month of December at both locations.
There were 23 days that December with dense fog here, a record for not only the month of December but any month of the year.
Bakersfield had 21 days with dense fog, tying an all-time record for the most days in a month also set in January 1985.
1965: A warm storm of torrential rains also melted mountain snow from 12.29 to 12.31.
One report said more than 13" fell in 24 hours at Mt. Baldy. Nearly 9" did fall in Lake Arrowhead, and 1.5"-3" in the coastal lowlands.
One drowned in Lytle Creek.
Disastrous flooding and debris flows occurred in the Lytle Creek and Scotland communities, Baldy Village, and in Waterman Canyon.
Two boys were rescued from the Santa Ana River in Colton.
Numerous roads were washed out in the high desert and the mountains.
1951: A heavy rain storm gave record daily rainfall to most stations in Southern California.
1947: It was 8° F in Palomar Mountain, the lowest temperature on record.
This also occurred on 1.4.1949.
1933: A major storm hit Southern California starting on this day and ending on 1.1.1934.
7.36" fell in 24 hours at LA, a 24 hour record for the city.
8.26" fell as a storm total.
Storm totals in the southern slopes of mountains topped 12" (heaviest: 16.29" in Azusa).
45 died all over Southern California in floods.
Walls of water and debris up to ten feet high were noted in some canyon areas.
1915: An extremely cold air mass brought extremely low temperatures.
The high temperature of 45° in Escondido was the second lowest high temperature on record.
1911: The morning low at Truckee was -22° F.
1907: 24" of snow fell at Truckee.
1891: A period of very cold weather started on 12.23 and ended on this day.
San Diego pools had ice 0.5" thick on the surface and ice one inch thick formed on oranges on trees in Mission Valley.
1879: 4.23" of rain fell in San Diego in 48 hours starting on 12.29 and ending on this day, the heaviest storm in 30 years.
Source: NWS San Francisco/Monterey, Hanford, Reno, & San Diego
Check out http://groups.yahoo.com/group/californiadisasters/
Read my blog at http://eclecticarcania.blogspot.com/
My Facebook: http://www.facebook.com/derkimster
Linkedin profile: http://www.linkedin.com/pub/kim-noyes/9/3a1/2b8
Follow me on Twitter @CalDisasters
Read my blog at http://eclecticarcania.blogspot.com/
My Facebook: http://www.facebook.com/derkimster
Linkedin profile: http://www.linkedin.com/pub/kim-noyes/9/3a1/2b8
Follow me on Twitter @CalDisasters
__._,_.___
Posted by: Kim Noyes <kimnoyes@gmail.com>
Be sure to check out our Links Section at http://groups.yahoo.com/group/californiadisasters/links
Please join our Discussion Group at http://groups.yahoo.com/group/californiadisasters_discussion/ for topical but extended discussions started here or for less topical but nonetheless relevant messages.
__,_._,___
[californiadisasters] On This Date In California Weather History (December 29)
2012: Numerous funnel clouds were reported off the southern Orange County coast.
Two waterspouts were reported, one off Dana Point, the other off Oceanside.
2004: A wind gust of 61 knots was measured at Angel Island in the San Francisco Bay.
Two waterspouts were reported, one off Dana Point, the other off Oceanside.
2004: A wind gust of 61 knots was measured at Angel Island in the San Francisco Bay.
2004: A storm wind of 58 mph was measured at Lindbergh Field from the south, the strongest December wind on record. 2.10" of rain fell in Borrego Springs, the greatest daily amount on record for December.
1997: Gusts of more that 60 mph were measured at Santa Ana.
1993: Dense fog, with visibilities as low as 50 feet, resulted in the death of a driver of a pick-up truck that collided with the rear of a milk truck near Hanford.
1992: 24.1" of snow fell at Virginia City.
1992: A tornado in San Clemente caused property damage.
1991: Back to back storms that started on 12.27 and ended on this day dropped 2"-7" of rainfall at lower elevations in the mountains of Southern California.
Flooding of low lying areas, mud slides, and closed highways resulted.
1988: A week of subfreezing temperatures hit Southern California starting on 12.24 and ending on 12.30.
Five died as a result of the cold.
1987: Cold front produced heavy snow over the Sierra from the 28th-29th: 34" at Grant Grove and 37.5" at Lodgepole (Tulare Co.).
1973: Strong winds caused damage in the Reno, NV, area.
A motel that was under construction lost its roof.
Nine house trailers were knocked off of their foundations.
1965: A warm storm of torrential rains also melted mountain snow from this day to 12.31.
One report said more than 13" fell in 24 hours at Mt. Baldy.
Nearly 9" did fall in Lake Arrowhead, and 1.5"-3" in the coastal lowlands.
One drowned in Lytle Creek.
Disastrous flooding and debris flows occurred in the Lytle Creek and Scotland communities, Baldy Village, and in Waterman Canyon.
Two boys were rescued from the Santa Ana River in Colton.
Numerous roads were washed out in the high desert and the mountains.
1963: The high temperature was 88° F in San Diego, the highest temperature on record for December.
1931: Heavy rains hit the San Bernardino Mountains.
Waterman and East Twin Creeks were raging torrents, causing several mudslides and washing several cabins from their foundations.
Thirteen mudslides were noted along Rim of the World Drive.
1891: A period of very cold weather started on 12.23 and ended on 12.30.
San Diego pools had ice 0.5" thick on the surface and ice one inch thick formed on oranges on trees in Mission Valley.
1879: 4.23" of rain fell in San Diego in 48 hours starting on this day and ending on 12.30, the heaviest storm in 30 years.
Source: NWS San Francisco/Monterey, Hanford, Reno, & San Diego
Check out http://groups.yahoo.com/group/californiadisasters/
Read my blog at http://eclecticarcania.blogspot.com/
My Facebook: http://www.facebook.com/derkimster
Linkedin profile: http://www.linkedin.com/pub/kim-noyes/9/3a1/2b8
Follow me on Twitter @CalDisasters
Read my blog at http://eclecticarcania.blogspot.com/
My Facebook: http://www.facebook.com/derkimster
Linkedin profile: http://www.linkedin.com/pub/kim-noyes/9/3a1/2b8
Follow me on Twitter @CalDisasters
__._,_.___
Posted by: Kim Noyes <kimnoyes@gmail.com>
Be sure to check out our Links Section at http://groups.yahoo.com/group/californiadisasters/links
Please join our Discussion Group at http://groups.yahoo.com/group/californiadisasters_discussion/ for topical but extended discussions started here or for less topical but nonetheless relevant messages.
__,_._,___
[californiadisasters] Researchers identify areas of plague risk in western United States
Researchers identify areas of plague risk in western United States
- Date:
- December 28, 2015
- Source:
- SUNY Downstate Medical Center
- Summary:
- Researchers have identified and mapped areas of high probability of plague bacteria in the western United States. This investigation predicted animal plague occurrence across western states based on reported occurrences of plague in sylvan (wild) and domestic animal hosts. Plague is a disease caused by Yersinia pestis, a bacterium found in rodents and their fleas in many areas around the world.
Researchers at SUNY Downstate Medical Center have identified and mapped areas of high probability of plague bacteria in the western United States. Their findings were published in a recent edition of the journal PeerJ.
This investigation predicted animal plague occurrence across western states based on reported occurrences of plague in sylvan (wild) and domestic animal hosts. Plague is a disease caused by Yersinia pestis, a bacterium found in rodents and their fleas in many areas around the world.
"This study used surveillance data of plague in wild and domestic animals in the American West to identify and map those areas with the greatest potential for human exposure to this infection, which can be particularly deadly when transmitted to humans," said Michael Walsh, PhD, MPH, assistant professor in the Department of Epidemiology and Biostatistics in the School of Public Health at SUNY Downstate.
"The findings can be used by public health agencies to target specific areas for enhanced plague surveillance within areas and counties predicted to be at high risk, as well as by other research teams to direct the sampling of local wildlife populations for the identification of Yersinia pestis in wild animals that find themselves in close proximity to humans and human developed landscapes," he added.
According to the federal Centers for Disease Control and Prevention (CDC), plague was first introduced into the United States in 1900, by rat-infested steamships that had sailed from affected areas. Epidemics occurred in port cities, with the last urban plague epidemic in the United States occurring in Los Angeles from 1924 through 1925. Plague then spread from urban rats to rural rodent species, and became entrenched in many areas of the western United States. Since that time, plague has occurred as scattered cases in rural areas. Most human cases in the United States occur in two regions: Northern New Mexico, northern Arizona, and southern Colorado; and California, southern Oregon, and far western Nevada
The CDC also notes that in recent decades, an average of seven human plague cases has been reported each year (range: 1-17 cases per year). Plague has occurred in people of all ages (infants up to age 96), though 50% of cases occur in people ages 12-45.
The authors note in their article that while zoonotic (animal) transmission to humans is much less common in modern times, significant plague risk remains in parts of the western U.S. Moreover, risk to some threatened species that are part of the epizootic cycle can be quite substantive.
This investigation attempted to predict the risk of plague across the western US by modeling the ecologic niche of plague in sylvan and domestic animals identified between 2000 and 2015. An algorithm was used to predict this niche based on climate, altitude, land cover, and the presence of an important enzootic (carrier) species, Peromyscus maniculatus (a rodent commonly known as the North American deermouse).
This model demonstrated good predictive ability and identified areas of high risk in central Colorado, north-central New Mexico, and southwestern and northeastern California.
The presence of P. maniculatus, altitude, precipitation during the driest and wettest quarters, and distance to artificial surfaces, all contributed substantively to maximizing the gain function. These findings add to the known landscape epidemiology and infection ecology of plague in the western U.S. and may suggest locations of particular risk to be targeted for wild and domestic animal intervention.
Story Source:
The above post is reprinted from materials provided by SUNY Downstate Medical Center. Note: Materials may be edited for content and length.
Journal Reference:
- Michael Walsh, MA Haseeb. Modeling the ecologic niche of plague in sylvan and domestic animal hosts to delineate sources of human exposure in the western United States. PeerJ, 2015; 3: e1493 DOI: 10.7717/peerj.1493
SUNY Downstate Medical Center. "Researchers identify areas of plague risk in western United States." ScienceDaily. ScienceDaily, 28 December 2015. <www.sciencedaily.com/releases/2015/12/151228174447.htm>.
--
__._,_.___
Posted by: Lin Kerns <linkerns@gmail.com>
Be sure to check out our Links Section at http://groups.yahoo.com/group/californiadisasters/links
Please join our Discussion Group at http://groups.yahoo.com/group/californiadisasters_discussion/ for topical but extended discussions started here or for less topical but nonetheless relevant messages.
__,_._,___
[Geology2] USGS and Utah Department of Natural Resources Announce New Record Low Elevation at Great Salt Lake’s North Arm
USGS and Utah Department of Natural Resources Announce New Record Low Elevation at Great Salt Lake's North Arm
Great Salt Lake Managed at Current Lake Level, through Comprehensive Management Plan
Released: 12/29/2015 1:05:00 PM
| Contact Information: U.S. Department of the Interior, U.S. Geological Survey Office of Communications and Publishing 12201 Sunrise Valley Dr, MS 119 Reston, VA 20192 | Jennifer LaVista Phone: 303-202-4764 Nathan Schwebach Phone: 801-440-9094 |
In partnership with: Utah Division of Wildlife Resources

The north arm of the Great Salt Lake (GSL) has reached a new historic low. According to the U.S. Geological Survey (USGS) and the Utah Division of Forestry, Fire and State Lands (FFSL), the lake's water level reached an elevation of 4,191.6 feet last month, one foot lower than the previous record. The low level has caused FFSL to exercise parts of the lake's management plan ensuring the lake can continue fulfilling its economic and ecological roles.
At 4,192.5 feet, the south arm of the lake remains more than one foot higher than its previous historic low of 4,191.35 feet set in 1963.
 |
| Water flowing through the Great Salt Lake breach in 2011, when lake levels were high due to above average snowfall in the Wasatch and Uinta Mountains. The Great Salt Lake breach is an area that allows water to travel between the southern and northern parts of the lake. |
 |
| For the first time since it was opened in 1984, water has stopped flowing through the Great Salt Lake causeway breach, an area that allows water to travel between the southern and northern parts of the lake. |
 |
| A gage to measure lake water levels stands dry in the lake bed of the Great Salt Lake. For the first time since it was opened in 1984, water has stopped flowing through the Great Salt Lake causeway breach, an area that allows water to travel between the southern and northern parts of the lake. |
"There is a chance the south arm of the Great Salt Lake could reach a historic low in 2016, but it depends on the amount of precipitation we get through the winter and spring months," said USGS scientist Cory Angeroth. "The condition of the current mountain snowpack is definitely a positive for the lake and hopefully the storms will keep coming."
For the first time since it opened in 1984, water has stopped flowing through the GSL's Union Pacific Railroad Causeway breach. It was built by the State of Utah to assist with flood control by allowing water to travel between the southern and northern parts of the lake.
Water levels have dropped on both sides of the causeway, preventing flow from the south arm to the north and leaving the breach dry. Union Pacific has worked in partnership with FFSL throughout 2015 and has permission from the state to construct a new bridge along the causeway to restore navigation and flow between the two arms. Construction started this fall.
"The health of the Great Salt Lake is important to the quality of life enjoyed in Utah. A healthy lake means thriving industry, which benefits the state's economy," said Laura Ault, FFSL sovereign lands program manager. "A healthy lake also results in more abundant water resources upstream, flourishing wildlife, recreational opportunities, improved ecosystems and better air quality. We're concerned about low lake levels because it can negatively impact the Wasatch Front's overall health."
The lake's size and health is affected by the historic fluctuation of its elevation. As a result, the state's approach to managing and protecting the lake must also be fluid and done in a way that maintains our quality of life. The FFSL manages the lake through a comprehensive management plan that adjusts and changes with the lake's current level.
The Great Salt Lake Comprehensive Management Plan guides FFSL, along with local, state and federal partners, in managing, allocating and appropriately using the GSL's sovereign land resources. Additionally, it outlines management goals, objectives and implementation strategies for guiding and directing future resource management actions, activities and recreational uses on the lake.
As the lake level has decreased in recent years, FFSL implemented management strategies to minimize adverse impacts to GSL resources and to further understand low lake level characteristics. Efforts included increased law enforcement on the lake bed; posting travel and off-highway vehicle closure notices along exposed areas to avoid impacts to nesting birds on Egg Island and increased research on how the exposed lake bed impacts regional air quality. Additionally, dredging of the Saltair Marina at Great Salt Lake State Park is scheduled to begin in the spring.
The USGS maintains a record of GSL elevations dating back to 1847 and has continuously measured the elevation of the lake since 1938. The USGS also conducts many studies on the hydrology, salinity, water quality and ecology of the lake. Learn more about the USGS studies on the GSL by visiting the USGS Utah Water Science Center website.
The Great Salt Lake Comprehensive Management Plan can be viewed or downloaded from the Division of Forestry, Fire and State Land's website.

USGS Landsat image compares water flowing through the Great Salt Lake breach in 2011 and no flow in 2015.

USGS Landsat imagery compares 2011 and 2015 Great Salt Lake water levels at the boat ramp on the east side.

USGS Landsat imagery compares 2011 and 2015 Great Salt Lake levels at the causewa
--
__._,_.___
Posted by: Lin Kerns <linkerns@gmail.com>
__,_._,___
Tuesday, December 29, 2015
Re: [californiadisasters] Four quakes near Devore, CA
I felt about 3 or 4 good bumps but the washer was running so I did not think much of it....
More Live Radio Fun and a Whole Lot More! Don KPC6NDB Upland, CA 34.10 -117.63 1250ft FRG-100B FunCube Dongle Pro+ ICF2010 Perseusx2 WR-G31DDCx2 R70 R71A w/250Hz R75x2 w/250Hz PRN1000x2 SDR-IQ SPR-4 SSR-1 SR-AF & LPF DSP599zx MFJ-784B HD-1418 AF-1 MSB-1 PA0RDT MW x2 @ 20ft DXE-ARAV3-1P @18ft RYOAA @ 20ft 28ft LF LNV ALA100Lx2 Z1501F @20ft
On 29-Dec-15 19:37, Dan Shapiro dnalaw@sbcglobal.net [californiadisasters] wrote:
The first one I heard loud and clear off in the distance as it came at me, then a pretty good shake here in Pedley. It made a couple of hairline cracks in my house bigger. I also heard and felt the first aftershock a few minutes later.
Dan
http://earthquake.usgs.gov/earthquakes/map/#{%22feed%22%3A%221day_m25%22%2C%22search%22%3Anull%2C%22listFormat%22%3A%22default%22%2C%22sort%22%3A%22newest%22%2C%22basemap%22%3A%22grayscale%22%2C%22autoUpdate%22%3Atrue%2C%22restrictListToMap%22%3Atrue%2C%22timeZone%22%3A%22utc%22%2C%22mapposition%22%3A[[29.19053283229458%2C-123.0908203125]%2C[43.26120612479979 %2C-94.4384765625]]%2C%22overlays%22%3A{%22plates%22%3Atrue}%2C%22viewModes%22%3A{%22list%22%3Atrue%2C%22map%22%3Atrue%2C%22settings%22%3Afalse%2C%22help%22%3Afalse}}
--
__._,_.___
Posted by: Don <stb55@verizon.net>
Be sure to check out our Links Section at http://groups.yahoo.com/group/californiadisasters/links
Please join our Discussion Group at http://groups.yahoo.com/group/californiadisasters_discussion/ for topical but extended discussions started here or for less topical but nonetheless relevant messages.
__,_._,___