VOLCANO WATCH: Mapping the world’s largest volcano
If a picture is worth a thousand words, a geologic map is priceless
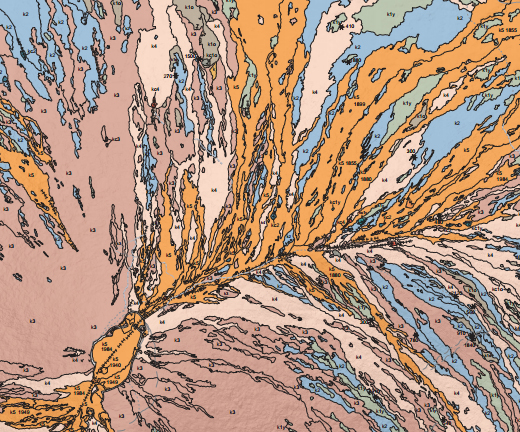
Close-up of the summit of Mauna Loa on the most recent “Geologic Map of the Island of Hawaii”, courtesy USGS
HAWAII ISLAND – Cartography, the art or science of making maps, is alive and well at the Hawaiian Volcano Observatory (HVO). Visualizing the dynamic three-dimensional geologic history of the island on a two-dimensional sheet of paper is no easy task, but it is one of the fundamental responsibilities of HVO. Maps that depict the earth’s surface in terms of rock age, lithology (composition and texture), and structures (volcanic vents, fissures, faults, and cracks) are called geologic maps.
Nationally, geologic maps are the most requested scientific product produced by state and federal geological surveys. They are tools with many applications: they help people understand the geologic history of an area, manage natural resources, assess hazards, and provide information for informed land-use planning and decisions.
Geologic maps help HVO scientists understand the events that have shaped the island and improve our ability to forecast hazards, such as lava flows, explosive eruptions, and tsunami, that will impact Hawai`i in the future. As time passes, the collective memory of a hazard’s impact often wanes ― Geologic maps serve as reminders of natural events that have faded from public consciousness. Understanding the forgotten past is paramount to preparing for what lies ahead.
 Improving the geologic map of Hawai`i Island is an ongoing goal of HVO. A combination of remote sensing and field-based techniques are currently utilized to map the geology of the volcanoes. While remote sensing plays an important role in understanding Kilauea’s current eruption, ground-based field mapping is relied on to decode previous eruptions throughout the island, especially on Mauna Loa.
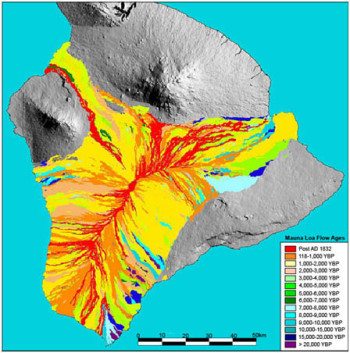
To date, 90 percent of Mauna Loa’s 5,271 sq-km (2,035 sq-mi) surface, covered by more than 500 individual flows, has been mapped. The ages for 35 percent of the mapped flows, the oldest of which is over 36,700 years old, have been constrained, using radiocarbon dating. Even with this wealth of data, HVO geologists working on Mauna Loa still have a long way to go before completing the map.
The summit of Mauna Loa stands at 4,170 m (13,679 ft) above sea level, and its slopes accommodate an impressive variety of climatic regimes. This environmental diversity presents a unique set of challenges to mapping the volcano: How do geologists map heavily forested regions? How can we tell the age of a flow for which radiocarbon dating is unavailable? How can we differentiate lava flows that look the same on the surface? Creative solutions have been developed for these and many other questions.
The type and amount of vegetation growing on the surface of a lava flow can help us determine the ages and boundaries of flows, relative to one another. Lava flows that host large-bodied `ohi`a trees and thick ground cover are generally older than those that host less mature and sparse foliage. We use these interpretations in conjunction with field work and aerial photographs to infer the boundaries between covered flows.
U.S. Geological Survey (USGS) volcanologists Jack Lockwood and Peter Lipman created a visual scale for determining the ages of Mauna Loa’s lava flows at higher elevations above the tree line, where carbon samples (for radiocarbon age-dating) are less likely to be discovered. Their scale relates surface color and weathering characteristics of a lava flow to its age. As a new lava flow is exposed to the elements and begins to break down, its surface color changes from black to grey, to brown, to tan, to orange, and finally to red. The longer the flow weathers, the greater its color progression. The utility of this technique, however, is influenced by elevation, rainfall, and forest cover.
When different lava flows exhibit similar surface characteristics, geologists look inside the rocks to understand differences. The things we examine include the sizes, shapes, and proportions of crystals; groundmass (matrix) texture; vesicle (gas bubble) shape; vesicle lining; and rock chemistry. These physical and chemical properties provide information about the lava’s origin and allow flows to be distinguished from one another.
The first geologic map of the island was published by the USGS and the Territory of Hawaii in 1946. The most current map, the “Geologic Map of the Island of Hawai`i,” is available online at (http://pubs.usgs.gov/ds/2005/144/), the USGS Publications Warehouse (http://pubs.er.usgs.gov/), and island bookstores, including those in Hawai‘i Volcanoes National Park.
http://www.bigislandvideonews.com/2013/06/21/volcano-watch-mapping-the-worlds-largest-volcano/
--

__._,_.___
No comments:
Post a Comment