Thursday, June 30, 2016

[californiadisasters] On This Date In California Weather History (June 30)


2015: Lightning struck the ground across inland San Diego County.
Fires were started by lightning in Poway, Vista, and La Mesa.
A power pole in Ramona was downed by lightning.

2013:
A heat wave on the order of a 20 year event enveloped the west and Southern California from 6/28 to 6/30.
Death Valley hit the highest U.S. June temperature ever recorded: 129
° F on 6/30.
On this day Palm Springs and Thermal reached 122° F, which tied or set new June records and came within one degree of the all-time highest temperature on record.
In Borrego Springs it was 120° F, two degrees off the highest all-time.

2007:
The rainfall season ended on this day as the driest on record for many locations of Orange County, the Inland Empire, and the San Bernardino Mountains.
In Santa Ana only 2.22° fell, in Riverside 1.71", and in Big Bear Lake 4.09°.
In Thermal only 0.17° fell, the lowest season on record (since 1950).

2001: The Martis Fire began and ultimately burned over 14,000 acres along the Carson Range.

1994: China Lake NAS reached a sweltering 118° F for a high temperature, highest ever in June.

1985: A heat wave started on this day and continued until 7.3.
It was 100° F or higher in parts of the city of San Diego.
A fire broke out in Normal Heights.

1982: Numerous reports of funnel clouds over Clovis.
One touched down near Fresno State University damaging some sprinklers.
Thunderstorms also caused street flooding in Farmersville and also flooded some homes in other parts of the Valley. 1.62" of rain reported at Dinuba.

1980: 80 fell in '80!
0.80" of rain fell in Palm Springs, the greatest daily rainfall amount on record for June.

1972: Mount Hamilton had a high of 94° F.

1972: It was 99° F in Palomar Mountain, the highest temperature on record for June.
This also occurred the previous day on 6.29.

1891: Fresno set an all-time record high for June, 112° F (tied on June 25, 1925).

Source: NWS San Francisco/Monterey, Hanford, Reno, & San Diego

--


__._,_.___

Posted by: Kim Noyes <kimnoyes@gmail.com>


Be sure to check out our Links Section at http://groups.yahoo.com/group/californiadisasters/links
Please join our Discussion Group at http://groups.yahoo.com/group/californiadisasters_discussion/ for topical but extended discussions started here or for less topical but nonetheless relevant messages.


__,_._,___

Re: [californiadisasters] new start-Kern Co, Stallion springs (Tehachapi)

I'm picking it up on scanner, and it appears to have been a house fire on the other side of the ridge...and they pretty much have it knocked down now and are mopping up. The "glowing smoke cloud" has disappeared and engines are being released.
Redhart


------------------------------------
Posted by: Linda <linda_crickett@yahoo.com>
------------------------------------

Be sure to check out our Links Section at http://groups.yahoo.com/group/californiadisasters/links
Please join our Discussion Group at http://groups.yahoo.com/group/californiadisasters_discussion/ for topical but extended discussions started here or for less topical but nonetheless relevant messages.
------------------------------------

Yahoo Groups Links

<*> To visit your group on the web, go to:
http://groups.yahoo.com/group/californiadisasters/

<*> Your email settings:
Individual Email | Traditional

<*> To change settings online go to:
http://groups.yahoo.com/group/californiadisasters/join
(Yahoo! ID required)

<*> To change settings via email:
californiadisasters-digest@yahoogroups.com
californiadisasters-fullfeatured@yahoogroups.com

<*> To unsubscribe from this group, send an email to:
californiadisasters-unsubscribe@yahoogroups.com

<*> Your use of Yahoo Groups is subject to:
https://info.yahoo.com/legal/us/yahoo/utos/terms/

[californiadisasters] new start-Kern Co, Stallion springs (Tehachapi)

Request for information on a fire south-east side of the Stallion Springs area of Tehachapi. Engines are screaming across the Cummings Valley toward it, and we can see the orange smoke and flames climbing up the back side of the ridge toward the area where homes are. Hard to tell from here (I'm no north side of Cummings Valley about 3-4 miles away), but somewhere between 3-10 acres. Most is hidden by a ridge.

No listing for this fire yet on wildlandfire.com

Redhart in Tehachapi


------------------------------------
Posted by: Linda <linda_crickett@yahoo.com>
------------------------------------

Be sure to check out our Links Section at http://groups.yahoo.com/group/californiadisasters/links
Please join our Discussion Group at http://groups.yahoo.com/group/californiadisasters_discussion/ for topical but extended discussions started here or for less topical but nonetheless relevant messages.
------------------------------------

Yahoo Groups Links

<*> To visit your group on the web, go to:
http://groups.yahoo.com/group/californiadisasters/

<*> Your email settings:
Individual Email | Traditional

<*> To change settings online go to:
http://groups.yahoo.com/group/californiadisasters/join
(Yahoo! ID required)

<*> To change settings via email:
californiadisasters-digest@yahoogroups.com
californiadisasters-fullfeatured@yahoogroups.com

<*> To unsubscribe from this group, send an email to:
californiadisasters-unsubscribe@yahoogroups.com

<*> Your use of Yahoo Groups is subject to:
https://info.yahoo.com/legal/us/yahoo/utos/terms/

Re: [Geology2] Lassen Peak Is Sinking, and Volcanologists Don’t Know Why


No.  The rest of the state is puffed up in self-importance.  ;-)


On 6/30/2016 4:46 PM, Lin Kerns linkerns@gmail.com [geology2] wrote:
 
06.29.16


Lassen Peak in northern California. The area                    around the active Cascade volcano has been sinking                    since the early 1990s.Lassen Peak in northern California. The area around the active Cascade volcano has been sinking since the early 1990s.Erik Klemetti

Most people tend to think of the Earth's surface as a static thing. It is solid and persistent … however, that is far from the truth. Images from earthquakes show how land can be broken and buckled with ease during one of these massive seismic events, but the surface can deform in even more subtle ways.

Take the Lassen Volcanic Center (a place near and dear to me). It last erupted in 1915, when Lassen Peak had its small but historically significant blast. After 100+ years, you might not expect that much is currently changing in the area. But data presented in a new paper by Amy Parker and others in the Journal of Volcanology and Geothermal Research shows that since the mid-1990s, the whole area has sunk!

The team examined satellite data from 1992 to 2010 and found that an area 30-40 kilometers (19-25 miles) across centered near Reading Peak (see below; just southeast of Lassen Peak) has been sinking at a rate of ~10 millimeters (~0.4 inches) per year. So, over that span the Lassen Peak area has subsided ~18 centimeters (~7 inches).

That measurement wouldn't be possible without using satellites to detect very minute changes in the Earth's surface over years to decades—in this case, with Interferometric Synthetic Aperture Radar, more commonly known as InSAR. This method uses precise measurements of the Earth's surface performed by satellites that were captured some time apart and then compares them, looking for where the data (land surface elevation) no longer matches, producing interference in the images. Then these interferences are converted into values of up and down based on the extent of interference. Considering InSAR uses microwaves to determine the elevation, things like cloud cover and night don't matter when the measurements are being taken. The only trick is you need to have the satellite pass over the same place multiple times to be able to compare the images.

InSAR is advantageous because it can not only measure small changes on the elevation of the Earth's surface, down to centimeter scale, but also because it can look at large geographic areas. The method can survey wide areas impacted by motion on a fault during an earthquake to see how the land surface has moved. It can examine entire volcanic arcs (or large stretches of them) to see which volcanoes might be showing signs of changes. Of course, our data set is limited due to the coverage of the satellites that can do these measurements (there aren't many) and the fact that InSAR hasn't been employed for more than a few decades.


The area of subsidence in the Lassen Volcanic                    Center (blue) identifying by InSAR data analysis. The                    larger triangle is Lassen Peak, the smaller triangle                    is Reading Peak.The area of subsidence in the Lassen Volcanic Center (blue) identifying by InSAR data analysis. The larger triangle is Lassen Peak, the smaller triangle is Reading Peak. The box delineates the Lassen Volcanic National Park. Walker and others (2016), Journal of Volcanology and Geothermal Research

Now, how long has this sinking been happening at the Lassen Volcanic Center? Parker and others looked at land-based geodetic data collected by leveling for the last 70 years and found no measurable evidence for subsidence prior to the early 1990s. Now, it could have been subsiding at a very low rate that wasn't measured, although the total across that span should have been noticed if it was sinking. So, it seems that this sinking is a (geologically) recent event in the Lassen area.

When you have geophysical data such as this, one thing you want to do is try to model the shape of the area causing the changing of the Earth's surface. In this case, Parker and others estimate that the source causing the sinking is a singular point (or centered around a point) that is ~8.3 kilometers (5.2 miles) beneath the volcanic center. It isn't directly under Lassen Peak, but offset to the southeast under some of the more hydrothermally active areas in the Lassen Peak area. It is at a depth that is roughly the same as where we think magma is being stored underneath the Lassen Volcanic Center, so that gives us that first clue to why the area is sinking.

Trying to identify why Lassen Peak and vicinity is sinking is a little tricky. As I just alluded, the most likely culprit is cooling and crystallizing of magma after the 1914-17 eruptions of Lassen Peak. As magma cools, it loses volume, so any new magma that trigger the eruption over 100 years ago may be slowly losing volume.

This can't alone account for the sinking, especially the timing as it appears to have started over 70 years after the eruption ended. You might expect that the sinking would have happened soon after the eruption ended (because you've expelled all that volume of magma and volcanic gas). However, as I mentioned above, Walker and others think that this sinking started only in the early 1990s. So, what else could be helping the subsidence beyond potential cooling of magma?


A photo of Lassen Peak erupting in 1915 by B.F.                    Loomis.A photo of Lassen Peak erupting in 1915 by B.F. Loomis.National Park Service

You can also change the flow of hydrothermal fluids (water heated by magma at depth) underneath the area to prompt subsidence. There is some loose correlation between the times of greater subsidence between 2004-07 and more earthquakes within the area of the hydrothermal system, so there could be connection there. There is even the chance that the M7.3 Landers earthquake in 1992, centered about 840 kilometers (520 miles) away, might have started the ball rolling as that earthquake seems to have triggered a M3.5 earthquake at Lassen within 13 minutes. However, these events are still correlations rather than causations without further study.

That being said, some of the sinking might not be related to the magmatism at the Lassen Volcanic Center at all. Local faults related to the Basin and Range province, where North America is stretching, are causing a deepening basin around the Lassen Volcanic Center and the warmer nature of the crust in the area (thanks to Lassen and friends) might mean this area is susceptible to more sinking compared to cooler areas. Medicine Lake in northern California is one of the other volcanoes in the Cascades that is also sinking. Studies there point the finger at tectonic forces along with cooling of a magma body at depth, so this combination might be a common occurrence in the Cascades.

Now, if you read this and think "huh, sounds like geologists don't know much about why a volcano subsides", you'd be right. Although dozens of volcanoes worldwide are subsiding (based on InSAR and other observations), for most we don't have a good grasp on exactly why. Some have had recent eruptions, others haven't erupted for millennia. Careful GPS surveys of these volcanoes (in cahoots with InSAR data) are needed to figure out all the vertical and horizontal pieces involved in the subsidence. Maybe then we can parse out each piece—magmatic, tectonic, hydrothermal—and then use these data to tell us about how volcanoes are behaving between eruptions and whether these changes can give us hints as to what might be next.

http://www.wired.com/2016/06/lassen-peak-sinking-volcanologists-dont-know/


--


__._,_.___

Posted by: Rick WA6NHC <wa6nhc@gmail.com>


__,_._,___

Re: [californiadisasters] Lassen Peak Is Sinking, and Volcanologists Don’t Know Why


Interesting reading.


On 6/30/2016 4:46 PM, Lin Kerns linkerns@gmail.com [californiadisasters] wrote:
06.29.16


Lassen Peak in northern California. The area around the              active Cascade volcano has been sinking since the early              1990s.Lassen Peak in northern California. The area around the active Cascade volcano has been sinking since the early 1990s.Erik Klemetti

Most people tend to think of the Earth's surface as a static thing. It is solid and persistent … however, that is far from the truth. Images from earthquakes show how land can be broken and buckled with ease during one of these massive seismic events, but the surface can deform in even more subtle ways.

Take the Lassen Volcanic Center (a place near and dear to me). It last erupted in 1915, when Lassen Peak had its small but historically significant blast. After 100+ years, you might not expect that much is currently changing in the area. But data presented in a new paper by Amy Parker and others in the Journal of Volcanology and Geothermal Research shows that since the mid-1990s, the whole area has sunk!

The team examined satellite data from 1992 to 2010 and found that an area 30-40 kilometers (19-25 miles) across centered near Reading Peak (see below; just southeast of Lassen Peak) has been sinking at a rate of ~10 millimeters (~0.4 inches) per year. So, over that span the Lassen Peak area has subsided ~18 centimeters (~7 inches).

That measurement wouldn't be possible without using satellites to detect very minute changes in the Earth's surface over years to decades—in this case, with Interferometric Synthetic Aperture Radar, more commonly known as InSAR. This method uses precise measurements of the Earth's surface performed by satellites that were captured some time apart and then compares them, looking for where the data (land surface elevation) no longer matches, producing interference in the images. Then these interferences are converted into values of up and down based on the extent of interference. Considering InSAR uses microwaves to determine the elevation, things like cloud cover and night don't matter when the measurements are being taken. The only trick is you need to have the satellite pass over the same place multiple times to be able to compare the images.

InSAR is advantageous because it can not only measure small changes on the elevation of the Earth's surface, down to centimeter scale, but also because it can look at large geographic areas. The method can survey wide areas impacted by motion on a fault during an earthquake to see how the land surface has moved. It can examine entire volcanic arcs (or large stretches of them) to see which volcanoes might be showing signs of changes. Of course, our data set is limited due to the coverage of the satellites that can do these measurements (there aren't many) and the fact that InSAR hasn't been employed for more than a few decades.


The area of subsidence in the Lassen Volcanic Center              (blue) identifying by InSAR data analysis. The larger              triangle is Lassen Peak, the smaller triangle is Reading              Peak.The area of subsidence in the Lassen Volcanic Center (blue) identifying by InSAR data analysis. The larger triangle is Lassen Peak, the smaller triangle is Reading Peak. The box delineates the Lassen Volcanic National Park. Walker and others (2016), Journal of Volcanology and Geothermal Research

Now, how long has this sinking been happening at the Lassen Volcanic Center? Parker and others looked at land-based geodetic data collected by leveling for the last 70 years and found no measurable evidence for subsidence prior to the early 1990s. Now, it could have been subsiding at a very low rate that wasn't measured, although the total across that span should have been noticed if it was sinking. So, it seems that this sinking is a (geologically) recent event in the Lassen area.

When you have geophysical data such as this, one thing you want to do is try to model the shape of the area causing the changing of the Earth's surface. In this case, Parker and others estimate that the source causing the sinking is a singular point (or centered around a point) that is ~8.3 kilometers (5.2 miles) beneath the volcanic center. It isn't directly under Lassen Peak, but offset to the southeast under some of the more hydrothermally active areas in the Lassen Peak area. It is at a depth that is roughly the same as where we think magma is being stored underneath the Lassen Volcanic Center, so that gives us that first clue to why the area is sinking.

Trying to identify why Lassen Peak and vicinity is sinking is a little tricky. As I just alluded, the most likely culprit is cooling and crystallizing of magma after the 1914-17 eruptions of Lassen Peak. As magma cools, it loses volume, so any new magma that trigger the eruption over 100 years ago may be slowly losing volume.

This can't alone account for the sinking, especially the timing as it appears to have started over 70 years after the eruption ended. You might expect that the sinking would have happened soon after the eruption ended (because you've expelled all that volume of magma and volcanic gas). However, as I mentioned above, Walker and others think that this sinking started only in the early 1990s. So, what else could be helping the subsidence beyond potential cooling of magma?


A photo of Lassen Peak erupting in 1915 by B.F.              Loomis.A photo of Lassen Peak erupting in 1915 by B.F. Loomis.National Park Service

You can also change the flow of hydrothermal fluids (water heated by magma at depth) underneath the area to prompt subsidence. There is some loose correlation between the times of greater subsidence between 2004-07 and more earthquakes within the area of the hydrothermal system, so there could be connection there. There is even the chance that the M7.3 Landers earthquake in 1992, centered about 840 kilometers (520 miles) away, might have started the ball rolling as that earthquake seems to have triggered a M3.5 earthquake at Lassen within 13 minutes. However, these events are still correlations rather than causations without further study.

That being said, some of the sinking might not be related to the magmatism at the Lassen Volcanic Center at all. Local faults related to the Basin and Range province, where North America is stretching, are causing a deepening basin around the Lassen Volcanic Center and the warmer nature of the crust in the area (thanks to Lassen and friends) might mean this area is susceptible to more sinking compared to cooler areas. Medicine Lake in northern California is one of the other volcanoes in the Cascades that is also sinking. Studies there point the finger at tectonic forces along with cooling of a magma body at depth, so this combination might be a common occurrence in the Cascades.

Now, if you read this and think "huh, sounds like geologists don't know much about why a volcano subsides", you'd be right. Although dozens of volcanoes worldwide are subsiding (based on InSAR and other observations), for most we don't have a good grasp on exactly why. Some have had recent eruptions, others haven't erupted for millennia. Careful GPS surveys of these volcanoes (in cahoots with InSAR data) are needed to figure out all the vertical and horizontal pieces involved in the subsidence. Maybe then we can parse out each piece—magmatic, tectonic, hydrothermal—and then use these data to tell us about how volcanoes are behaving between eruptions and whether these changes can give us hints as to what might be next.

http://www.wired.com/2016/06/lassen-peak-sinking-volcanologists-dont-know/


--


--   Michael T. Sager, KI6RGR, WQWJ405  Vallejo, CA (cm88vc)  SKYWARN Spotter S059 Solano County


__._,_.___

Posted by: "Michael, KI6RGR" <KI6RGR@earthlink.net>


Be sure to check out our Links Section at http://groups.yahoo.com/group/californiadisasters/links
Please join our Discussion Group at http://groups.yahoo.com/group/californiadisasters_discussion/ for topical but extended discussions started here or for less topical but nonetheless relevant messages.


__,_._,___

[Geology2] 1815 UK geologic map remains the benchmark


1815 UK geologic map remains the benchmark

Date:
June 28, 2016
Source:
Geological Society of America
Summary:
Although most people do not regularly appreciate it, geologic maps have been and remain a critical foundation of industrial society. They are used for myriad purposes, from locating and developing natural resources, to identifying and preparing for natural hazards, to building and maintaining infrastructure.

Although most people do not regularly appreciate it, geologic maps have been and remain a critical foundation of industrial society. They are used for myriad purposes, from locating and developing natural resources, to identifying and preparing for natural hazards, to building and maintaining infrastructure.

Many people who are familiar with introductory geology, via courses or reading, know that William Smith presented the first good geological map in 1815, a large map covering much of Great Britain. But beyond being the first such map, why was it so revolutionary and why is it still revered?

In the July issue of GSA Today, Peter Wigley addresses these very questions. Through digitization of "The 1815 Map" and poring through contemporary documents, Wigley describes how original map features were produced and presented, and compares these to those used in the generation of modern geologic maps for the same region.

Two hundred years later, the original map remains astonishingly accurate. The reasons lie in the combination of a brilliantly creative individual, a crucial collaborator, some timely technology, and an intriguing taxation law. While Wigley does not draw parallels to developments over the last few decades, one could certainly suggest a recurring theme and perhaps a future Hollywood movie.


Story Source:

The above post is reprinted from materials provided by Geological Society of America. Note: Materials may be edited for content and length.


Journal Reference:

  1. Peter Wigley. The development and evolution of the William Smith 1815 geological map from a digital perspective. GSA Today, 2016; 26 (7): 4 DOI: 10.1130/GSATG279A.1


Geological Society of America. "1815 UK geologic map remains the benchmark." ScienceDaily. ScienceDaily, 28 June 2016. <www.sciencedaily.com/releases/2016/06/160628182530.htm>.

--


__._,_.___

Posted by: Lin Kerns <linkerns@gmail.com>


__,_._,___

[Geology2] Plate tectonics without jerking: Detailed recordings of earthquakes on ultraslow mid-ocean ridges


Plate tectonics without jerking: Detailed recordings of earthquakes on ultraslow mid-ocean ridges

Date:
June 29, 2016
Source:
Alfred Wegener Institute, Helmholtz Centre for Polar and Marine Research
Summary:
The earthquake distribution on ultra-slow mid-ocean ridges differs fundamentally from other spreading zones. Water circulating at a depth of up to 15 kilometers leads to the formation of rock that resembles soft soap. This is how the continental plates on ultra-slow mid-ocean ridges may move without jerking, while the same process in other regions leads to many minor earthquakes, according to geophysicists.

The earthquake distribution on ultraslow mid-ocean ridges differs fundamentally from other spreading zones. Water circulating at a depth of up to 15 kilometres leads to the formation of rock that resembles soft soap. This is how the continental plates on ultraslow mid-ocean ridges may move without jerking, while the same process in other regions leads to many minor earthquakes, according to geophysicists of the Alfred Wegener Institute, Helmholtz Centre for Polar and Marine Research (AWI). Their study is going to be published advanced online in the journal Nature on Wednesday, June 29, 2016.

Mountain ranges like the Himalayas rise up where continental plates collide. Mid-ocean ridges, where the continents drift apart, are just as spectacular mountain ranges, but they are hidden in the depths of the oceans. On the seabed, like on a conveyor belt, new ocean floor (oceanic lithosphere) is formed as magma rises from greater depths to the top, thus filling the resulting gap between the lithospheric plates. This spreading process creates jerks, and small earthquakes continuously occur along the conveyor belt. The earthquakes reveal a great deal about the origin and structure of the new oceanic lithosphere. On the so-called ultraslow ridges, the lithospheric plates drift apart so slowly that the conveyor belt jerks and stutters and, because of the low temperature, there is insufficient melt to fill the gap between the plates. This way, the earth's mantle is conveyed to the seabed in many places without earth crust developing. In other locations along this ridge, on the other hand, you find giant volcanoes.

Ultraslow ridges can be found under the sea ice in the Arctic and south of Africa along the Southwest Indian Ridge in the notorious sea areas of the Roaring Forties and Furious Fifties. Because these areas are so difficult to access, earthquakes have not been measured there. And so until now, little was known about the structure and development of around 20 percent of the global seabed.

With the research vessel Polarstern, a reliable workhorse even in heavy seas, the researchers around Dr Vera Schlindwein of the Alfred Wegener Institute, Helmholtz Centre for Polar and Marine Research (AWI), have now for the first time risked deploying a network of ocean bottom seismometers (OBS) at the Southwest Indian Ridge in the Furious Fifties and recovered them a year later. At the same time, a second network was placed on a volcano in the more temperate latitudes of the Southwest Indian Ridge. "Our effort and our risk were rewarded with a unique set of earthquake data, which for the first time provides deep insights into the formation of the ocean floor when spreading rates are very slow," explains AWI geophysicist Vera Schlindwein.

Her results turn current scientific findings on the functioning of ultra-slow mid-ocean ridges upside down: Schlindwein and her PhD student Florian Schmid found that water may circulate up to 15 kilometres deep in the young oceanic lithosphere, i.e. the earth crust and the outer part of the earth mantle. If this water comes into contact with rock from the earth mantle, a greenish rock called serpentinite forms. Even small quantities of ten percent serpentinite are enough for the rock to move without any earthquakes as if on a soapy track. The researchers discovered such aseismic areas, clearly confined by many small earthquakes, in their data.

Until now, scientists thought that serpentinite only forms near fault zones and near the surface. "Our data now suggest that water circulates through extensive areas of the young oceanic lithosphere and is bound in the rock. This releases heat and methane, for example, to a degree not previously foreseen," says Vera Schlindwein.

The AWI geophysicists were now able to directly observe the active spreading processes using the ocean floor seismometers, comparing volcanic and non-volcanic ridge sections. "Based on the distribution of earthquakes, we are for the first time able to watch, so to speak, as new lithosphere forms with very slow spreading rates. We have not had such a data set from ultra-slow ridges before," says Vera Schlindwein.

"Initially, we were very surprised that areas without earth crust show no earthquakes at all down to 15 kilometres depth, even though OBS were positioned directly above. At greater depths and in the adjacent volcanic areas, on the other hand, where you can find basalt on the sea floor and a thin earth crust is present, there were flurries of quakes in all depth ranges," says Vera Schlindwein about her first glance at the data after retrieving the OBS with RV Polarstern in 2014.

The results also have an influence on other marine research disciplines: geologists think about other deformation mechanisms of the young oceanic lithosphere. Because rock that behaves like soft soap permits a completely different deformation, which could be the basis of the so-called "smooth seafloor" that is only known from ultra-slow ridges. Oceanographers are interested in heat influx and trace gases in the water column in such areas, which were previously thought to be non-volcanic and "cold." Biologists are interested in the increased outflow of methane and sulphide on the sea floor that is to be expected in many areas and that represents an important basis of life for deep-sea organisms.


Story Source:

The above post is reprinted from materials provided by Alfred Wegener Institute, Helmholtz Centre for Polar and Marine Research. Note: Materials may be edited for content and length.


Journal Reference:

  1. Vera Schlindwein, Florian Schmid. Mid-ocean-ridge seismicity reveals extreme types of ocean lithosphere. Nature, 2016; DOI: 10.1038/nature18277

Alfred Wegener Institute, Helmholtz Centre for Polar and Marine Research. "Plate tectonics without jerking: Detailed recordings of earthquakes on ultraslow mid-ocean ridges." ScienceDaily. ScienceDaily, 29 June 2016. <www.sciencedaily.com/releases/2016/06/160629135238.htm>.

--


__._,_.___

Posted by: Lin Kerns <linkerns@gmail.com>


__,_._,___

[Geology2] Asteroid day will draw eyes to the stars, but the more urgent threat may be under our feet


Asteroid day will draw eyes to the stars, but the more urgent threat may be under our feet

Date:
June 29, 2016
Source:
University of Alabama at Birmingham
Summary:
Knowing when an asteroid could impact Earth would be nice, but learning more about the impact a super volcano eruption at Yellowstone would have on civilization -- and how to be ready for it -- might be more prudent.

June 30 is Asteroid Day, a global awareness effort to promote asteroids and discussion around what can be done to protect our planet from impacts, but there may be a more likely natural threat.

While an asteroid impact with Earth may make for great drama in the movies, no human in the past 1,000 years is known to have been killed by a meteorite or by the effects of one impacting our planet, according to NASA. That is just one reason Robert Mohr, Ph.D., instructor in the University of Alabama at Birmingham's College of Arts & Sciences, says energies might be better spent on the super volcano under Yellowstone.

"If the Yellowstone super volcano erupts, it will take out anywhere from 20-30 percent of the continent," Mohr said. "And the effects will be felt basically everywhere in the United States and in places beyond, potentially for years."

Aside from giant asteroid strikes, super volcanoes are considered to be the most devastating of all natural disasters. Super volcanoes have been known to cause mass extinctions and long-term climate changes.

The last known super volcano eruption, believed to have occurred around 70,000 years ago on the site of today's Lake Toba in Sumatra, Indonesia, caused a "volcanic winter" that blocked out the sun for six to eight years.

The super volcano that erupted in Wyoming 600,000 years ago, in what is now Yellowstone National Park, ejected more than 1,000 cubic kilometers of lava and ash into the atmosphere -- enough to bury a large city several kilometers deep. By comparison, the 1991 eruption of Mount Pinatubo in the Philippines, which caused a 0.4 degree drop in average global temperature for the following year, was 100 times less forceful than the Yellowstone eruption.

"A Yellowstone eruption would alter life as we know it for a long time," Mohr said. "Sunlight would be blocked for long periods of time, which would affect crop growth and food supply. Preparing for something like that, which is a lot closer to a likelihood than an asteroid's hitting Earth, would seem to me to be more prudent."

NASA knows of no asteroid or comet currently on a collision course with Earth. In fact, as far as the agency can tell, no large object is likely to strike the Earth any time in the next several hundred years. To be able to better calculate the statistics and narrow down concrete possibilities, astronomers need to detect as many of the near-Earth objects as possible -- an exercise that is quite hard to achieve with asteroids.

Mohr knows some will disagree with the notion that a super volcano is a more worrisome threat, and he admits it would be "nice to know" if an asteroid were heading straight for us. But he says the likelihood of discovering any asteroid far ahead of impact is quite small.

"There is no easy way to find an asteroid," he said. "It's not like looking for Easter eggs in a defined yard. There's a whole bunch of sky, and you're looking for something extremely small and that doesn't really give off a whole lot of light, so it doesn't show itself well. Where the asteroid is going to be in the sky and the odds of your actually being able to take a telescope, point it at the asteroid and pick it out with all the other stuff you're going to see in the telescope are very, very low -- even if it's right there."


Story Source:

The above post is reprinted from materials provided by University of Alabama at Birmingham. The original item was written by Tyler Greer. Note: Materials may be edited for content and length.


University of Alabama at Birmingham. "Asteroid day will draw eyes to the stars, but the more urgent threat may be under our feet." ScienceDaily. ScienceDaily, 29 June 2016. <www.sciencedaily.com/releases/2016/06/160629130630.htm

--


__._,_.___

Posted by: Lin Kerns <linkerns@gmail.com>


__,_._,___

[Geology2] Why Liverpool University is monitoring volcanoes around the world


Why Liverpool University is monitoring volcanoes around the world


Education Partner
Jun 30th, 2016

The volcano is one of the most complex geological occurrences in the natural world. With the power to blast cascades of gas through an angry, ashen sky; to fire streams of molten lava and leave paths of smouldering destruction in the wake of its scorching tide; to breathe life back into the Earth and stand as a pillar of strength when it shakes to its very core; the volcano is undoubtedly one of the most awesome forces at work in the natural environment.

"Volcanoes are a spectacular and dangerous embodiment of the dynamic nature of our planet," says Oliver Lamb, PhD student at the Volcanology Research Group at University of Liverpool's School of Environmental Sciences. "An estimated 800 million people now live within 100km of an active volcano around the world, and this figure continues to increase every year."

And yet, in spite of its potential for destruction, the volcano is a landform mankind simply could not live without. The ability to feed precious nutrients to our soils, for example, helps fertilise the Earth, creating the perfect conditions for farmers to grow crops. Some volcanoes even form crucial parts of the Earth's tectonic plates, the absence of which would mean arid land could not be revived, and the forces of weathering by water, wind and ice would eventually consume it, leaving Earth a genuine 'water world'.


Image courtesy of the University of Liverpool.

While the benefits of the volcano are invaluable, the dangers are devastating and entirely unpredictable. And it is for this reason "that the need for a better understanding of volcanoes and their behaviour is as great as ever," says Oliver Lamb.

"Volcanoes are complex beasts: no two volcanoes behave exactly the same," Oliver continues. "Indeed, a single volcano might display completely different eruptive behaviour within a human lifetime. This presents a huge challenge for scientists responsible for monitoring volcanoes around the world."

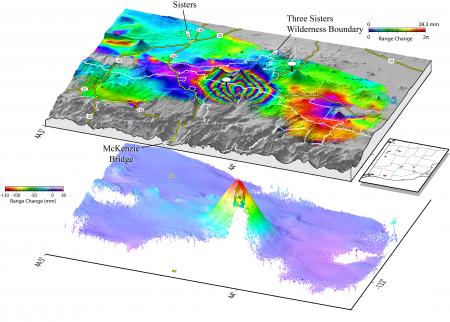
The Volcanology Group at the University of Liverpool is actively involved in this sort of field work, playing a major part in the monitoring of volcanoes on a global scale. Using a wide range of intricate geophysical monitoring equipment, such as seismometers, channel digitizers, infrasound microphones and other complex gadgets, scientists are able to constrain fundamental magmatic and volcanic processes, as well as conduct the pioneering studies that provide answers to signals behind magma transport and eruptions through the Earth's surface.

"While we may be able to detect the signs that magma is rising inside a volcano, there is still no reliable means for determining whether the magma will reach the surface, and if it does, how violent and prolonged the eruption will be," Oliver adds.


Image courtesy of the University of Liverpool.

As one of the most innovative and interdisciplinary volcanology research groups of its kind in Europe, Liverpool's Volcanology Group is doing everything it can to help the world understand the inner workings of the volcano.

Earlier this year, for example, an experienced team of volcanologists from the University of Liverpool and the Ludwig Maximilian University of Munich helped develop a brand new method to assess the impact of volcanic ash on jet engines.

"The atmospheric spreading of ash from prolonged eruptions can bring widespread disruption to air travel on a continental scale; something highlighted by the 2010 eruption of Eyjafjallajökull in Iceland," Oliver notes.

In their most recent study, researchers from the university examined volcanic ash samples from nine different variants, allowing them to identify exactly how its chemical composition affects its behaviour when it melts at jet engine temperatures, which can range between a scorching 1100°C and 2000°C.


Image courtesy of the University of Liverpool.

While there still remains little proven knowledge on the subject, volcanic ash is universally understood to be a potentially fatal hazard for all airborne vehicles, largely due to its potential to melt and glue to the inside of engine turbines. According to researchers, this can be particularly problematic if it seeps into the cooling system.

"Our experiments are the first study to test the conditions for which ash can melt using chemical criteria," says Professor Yan Lavallée, a leading volcanologist at Liverpool's School of Environmental Sciences. "Through our experiments we were able to develop a model to predict the melting and sticking conditions of different volcanic ash particles.

"We are able to show that volcanic ash may melt and stick more readily inside jet engines, and that the common use of sand or dust is wholly inadequate for the prediction of the behaviour of volcanic ash.

"With the current level of aerial traffic, understanding the generation, transport and impact of volcanic ash becomes a priority and too much is at stake to overlook the role of volcanic ash on aviation."

With the impact of ground breaking research such as this, researchers from the University of Liverpool are not only helping the world get to grips with one of the most complex forces at work in the natural world, they are also helping save lives on a truly global scale.

https://www.studyinternational.com/news/why-liverpool-university-is-monitoring-volcanoes-around-the-world


--


__._,_.___

Posted by: Lin Kerns <linkerns@gmail.com>


__,_._,___

[Geology2] Google is adding recent earthquake data to search results


Google is adding recent earthquake data to search results

  • on June 30, 2016

Google is making it easier to find out useful information in the event of an earthquake. Searching for terms like "earthquake" or "earthquakes near me" will show a card with data like the magnitude and epicenter of the relevant quake, as well as other recent tremors to put it into context.

This mapping information will be particularly useful for finding out whether a seemingly minor earthquake was actually a major one further away; it'll show how strong the quake was in various areas. Google will also display tips for how best to stay safe in the earthquake's aftermath.

google earthquakes gif

Living in Japan, earthquakes are a pretty frequent occurrence for me, and the first thing I usually do after feeling one is check Twitter to see other people's real-time reactions and make sure it's not too serious. If this Google feature works well, however, it could be a more reliable and easily parseable way to get the most important information fast.

http://www.theverge.com/2016/6/30/12064594/google-search-earthquake-information
--


__._,_.___

Posted by: Lin Kerns <linkerns@gmail.com>


__,_._,___
Newer Posts Older Posts Home